Better to Start with Some Thanks...
Let me start this post with a lot of gratitude for Noah Rosenblatt and his team at Urban Digs. I have relied on their data and insights for years, and they have never steered me wrong. This month, I want to share a number of data points and graphs that in my view demonstrate one thing: A market that is growing healthier by the day. Note that I didn't say prices were going to go up from here, nor that it's a buyer's or seller's market. But it is definitely a healthier market: more listings, more sales, and more data to digest. So here goes...
Let's Proceed With the Q1 Numbers
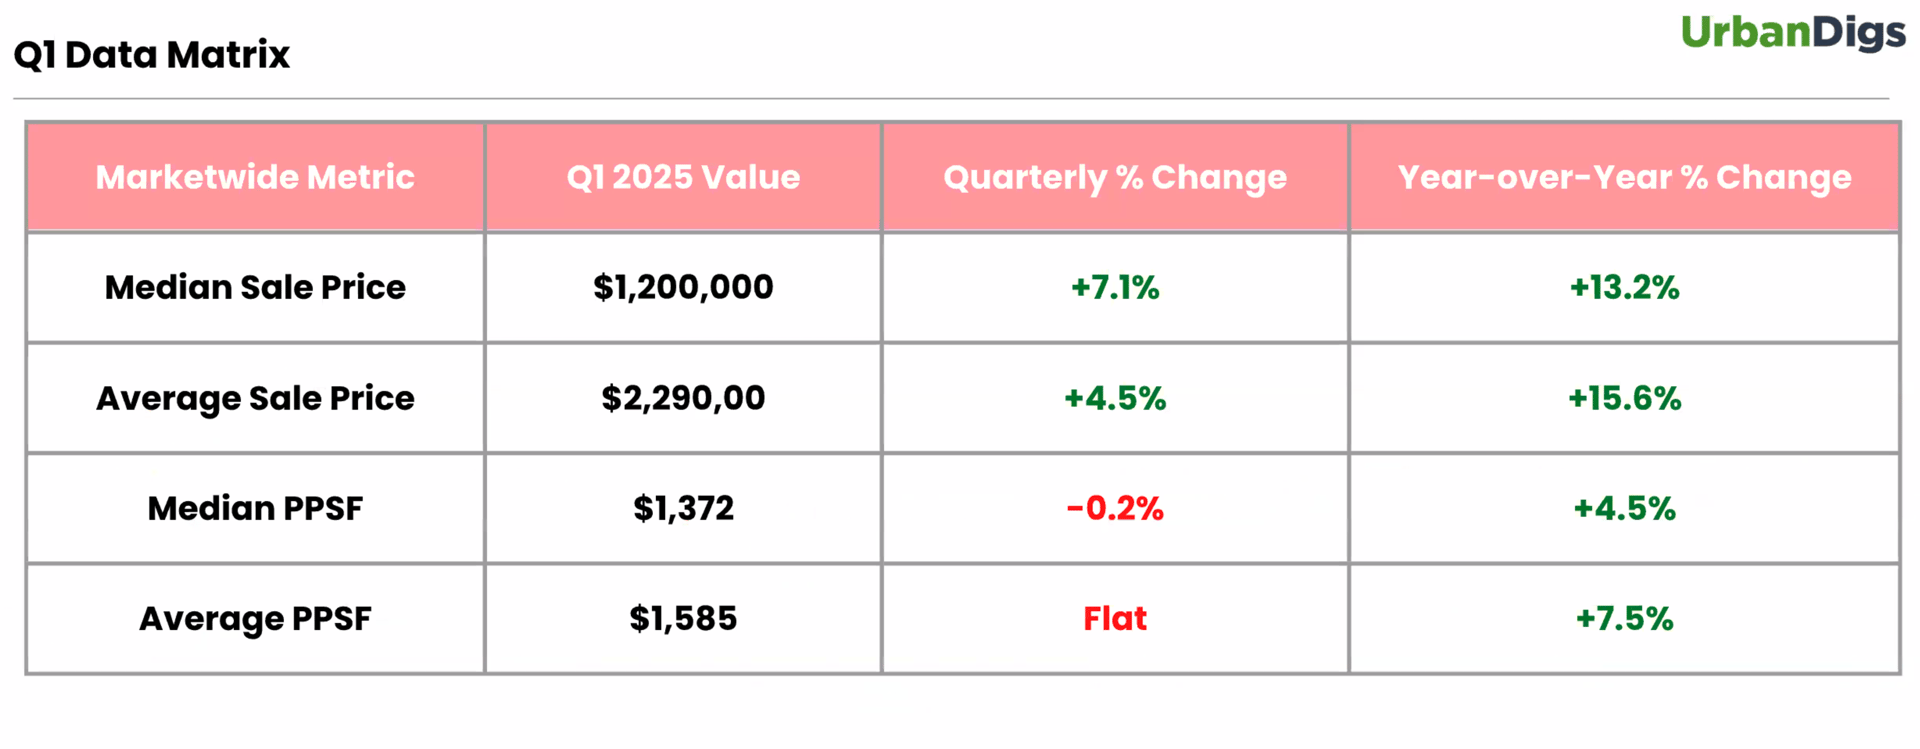
Across the whole of the market, you need to combine two things to understand the numbers. Both the average and the median sale price numbers were up (15.6% and 13.2% respectively) year over year, but does that mean that prices were rising? Not at all. What it demonstrates is that the deals that were coming together were at higher price points. There has been outsized deal flow at the high end of the market for the last two years, as you can see in this report here (h/t Donna Olshan of the Olshan Report).
Moving Onto Days on Market
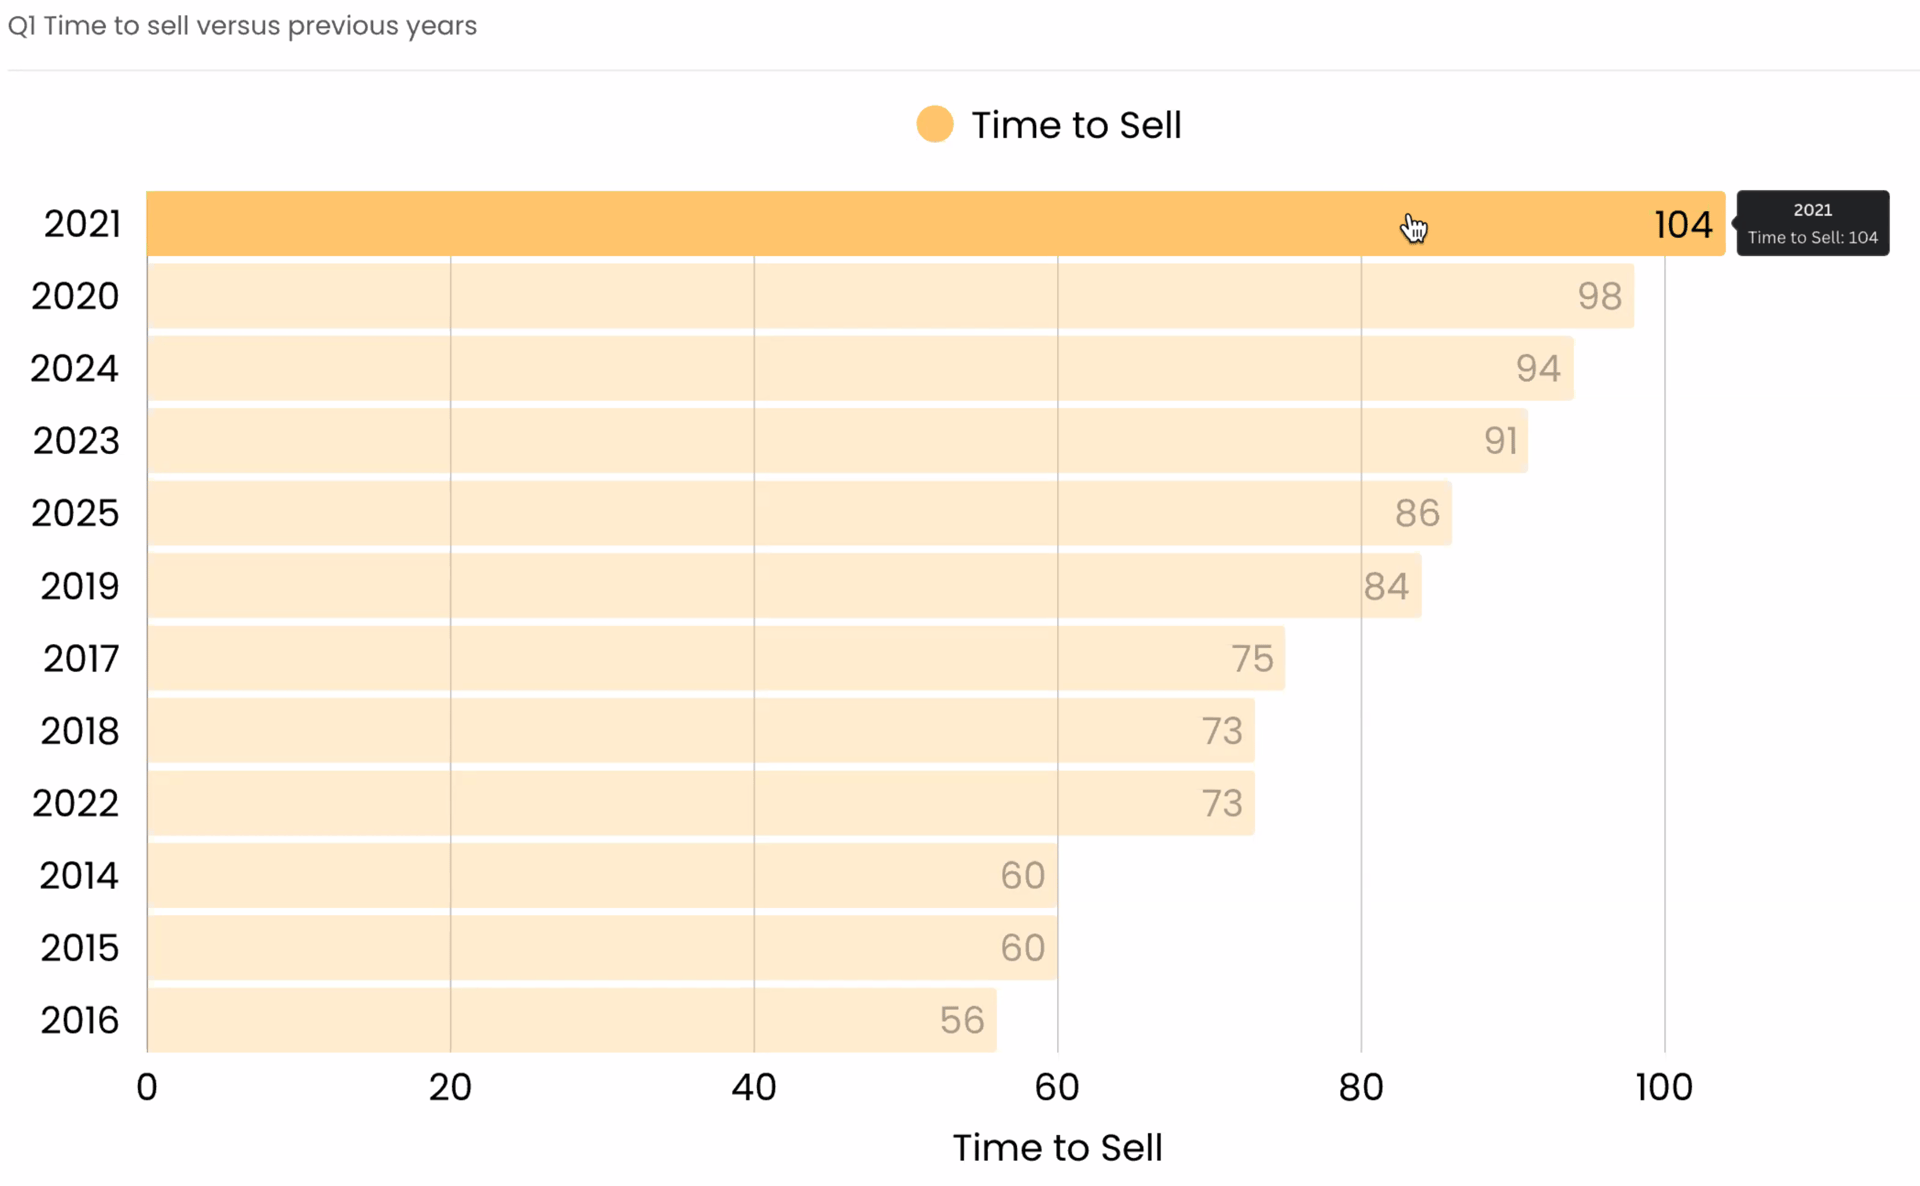
Another sign that things are healthy is that time on market, otherwise known as "days on market" is lower than it was in 2023 and 2024. In fact, it's only about 2 weeks longer than 2022, which was widely recognized as a very busy year (at least for the first half).
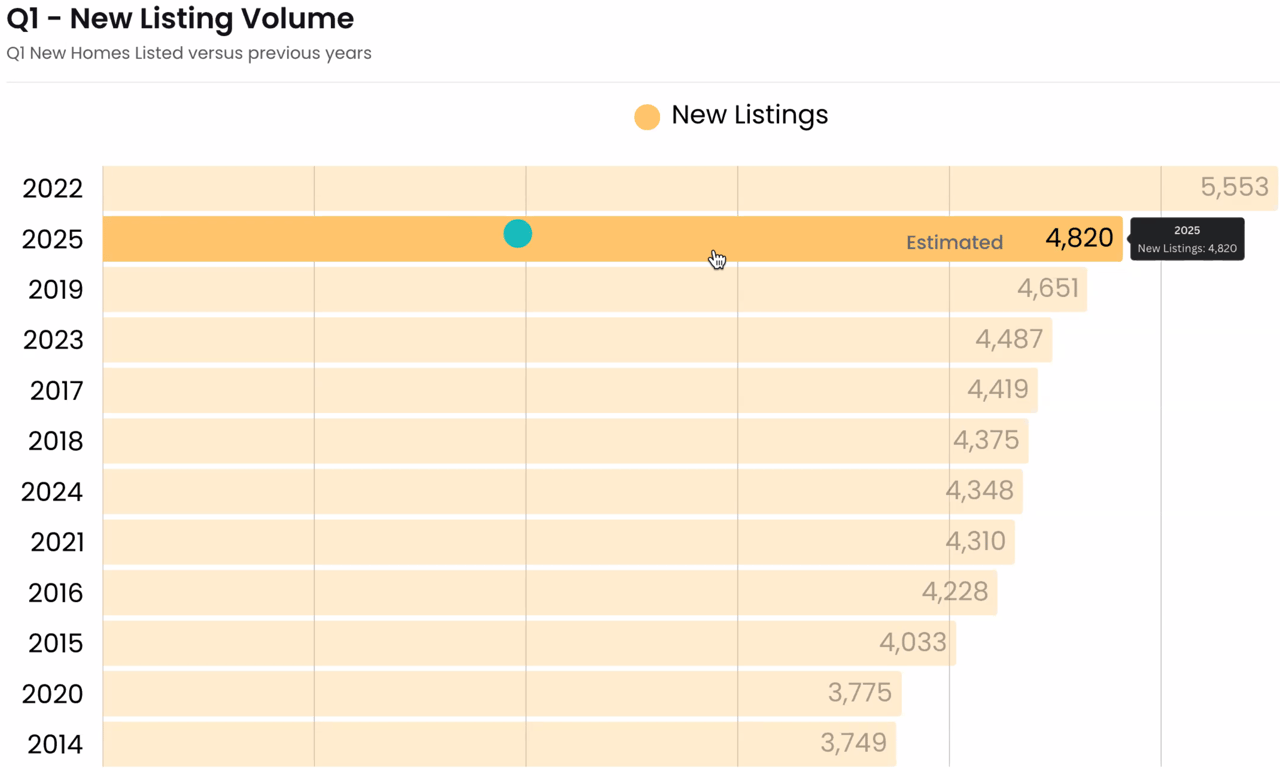
Now Look at Inventory

This is where things get very interesting. By this point of the year, we can see that 2025 is shaping up to be a much healthier market. Inventory is up about 15% above where it was this time last year, and in 2023. Out of the gate, it is stronger than what we saw in 2014-2016, which were largely considered strong seller's markets.
Now The Rubber Really Meets the Road
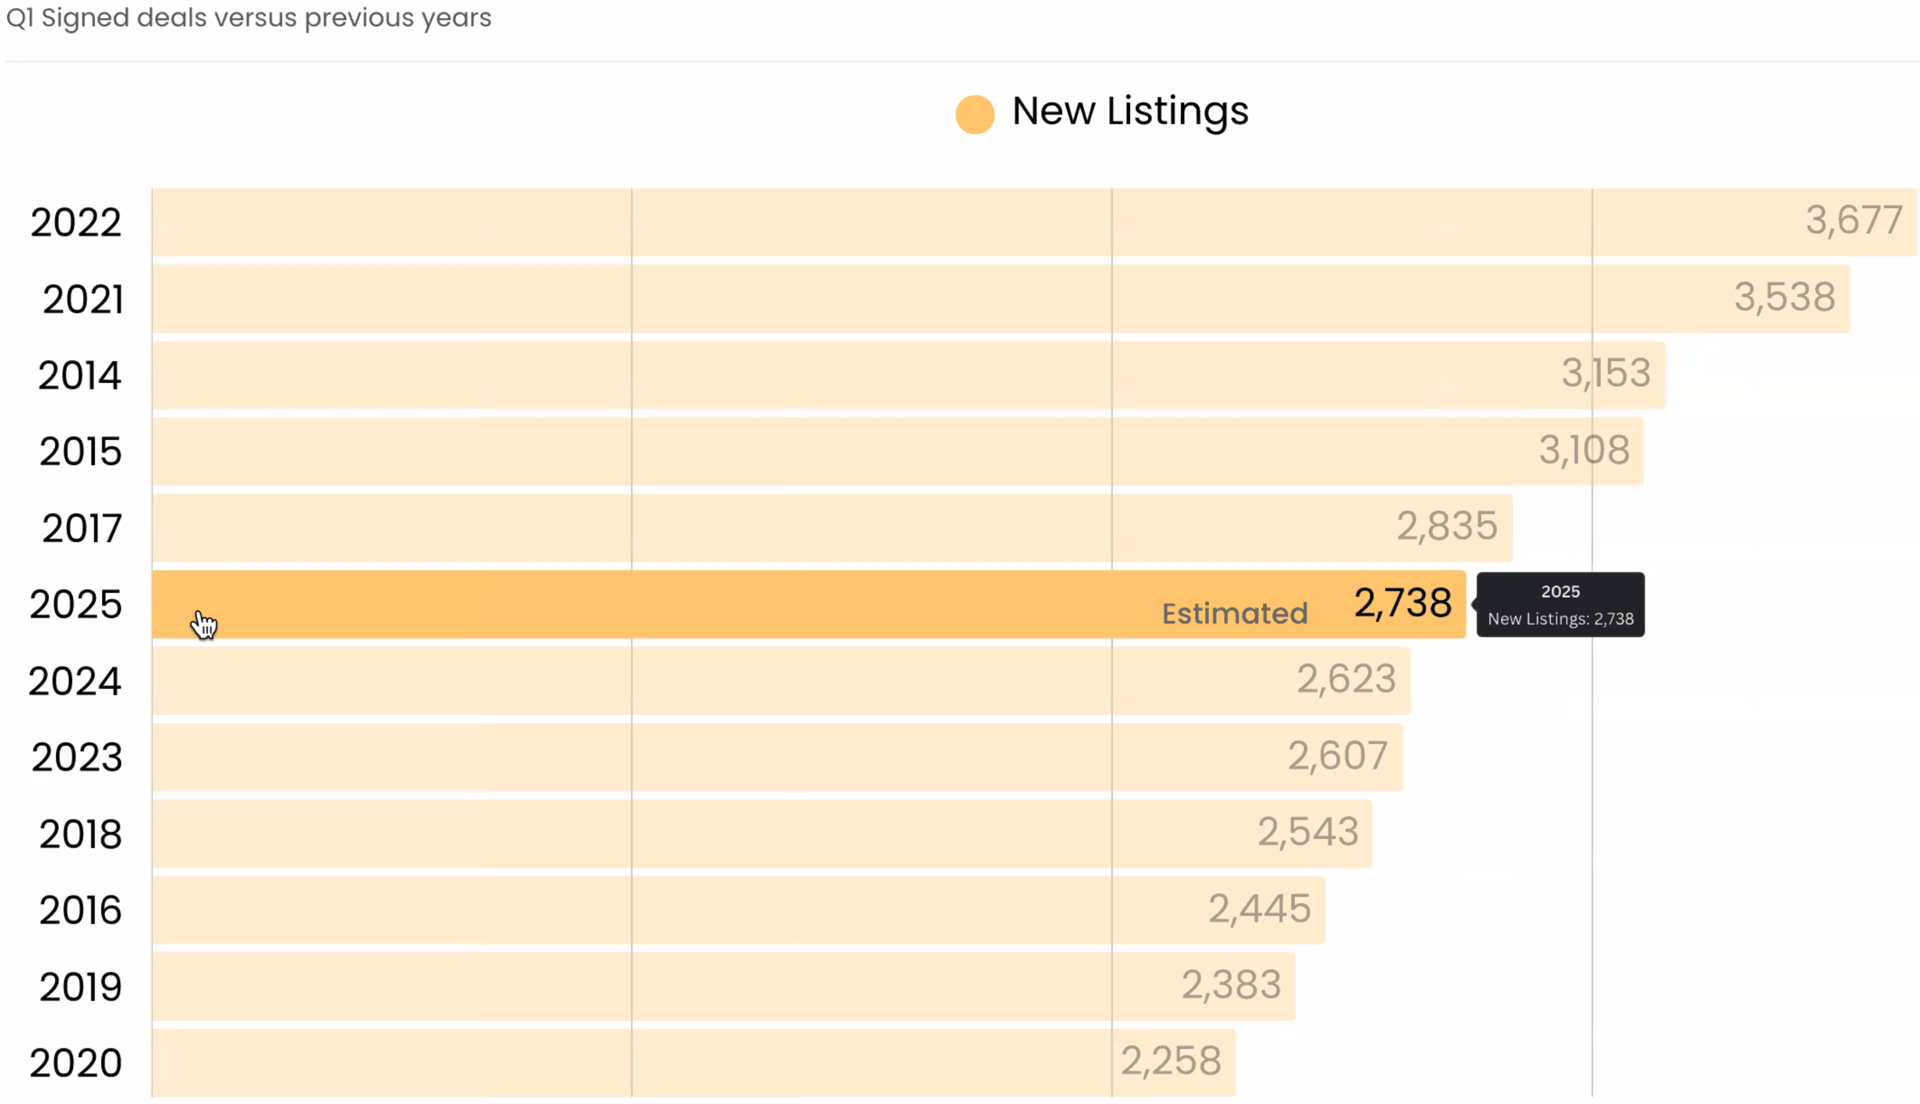
This is where it gets interesting. The estimated number of deals year-to-date is up about 5% year over year. And you can see what I have been talking about for years.
1) 2023 and 2024 were considered very challenging real estate markets
2) 2018 and 2019 leading up to COVID were slow year as well.
3) 2022 was considered one of the highest volume years in memory
4) 2014 and 2015 were among the busiest years and widely regarded as a seller's market.
5) The fact that 2025 is where it is bodes well for the strength of the market, putting price to the side.
What Does This Mean for Buyers and Sellers?
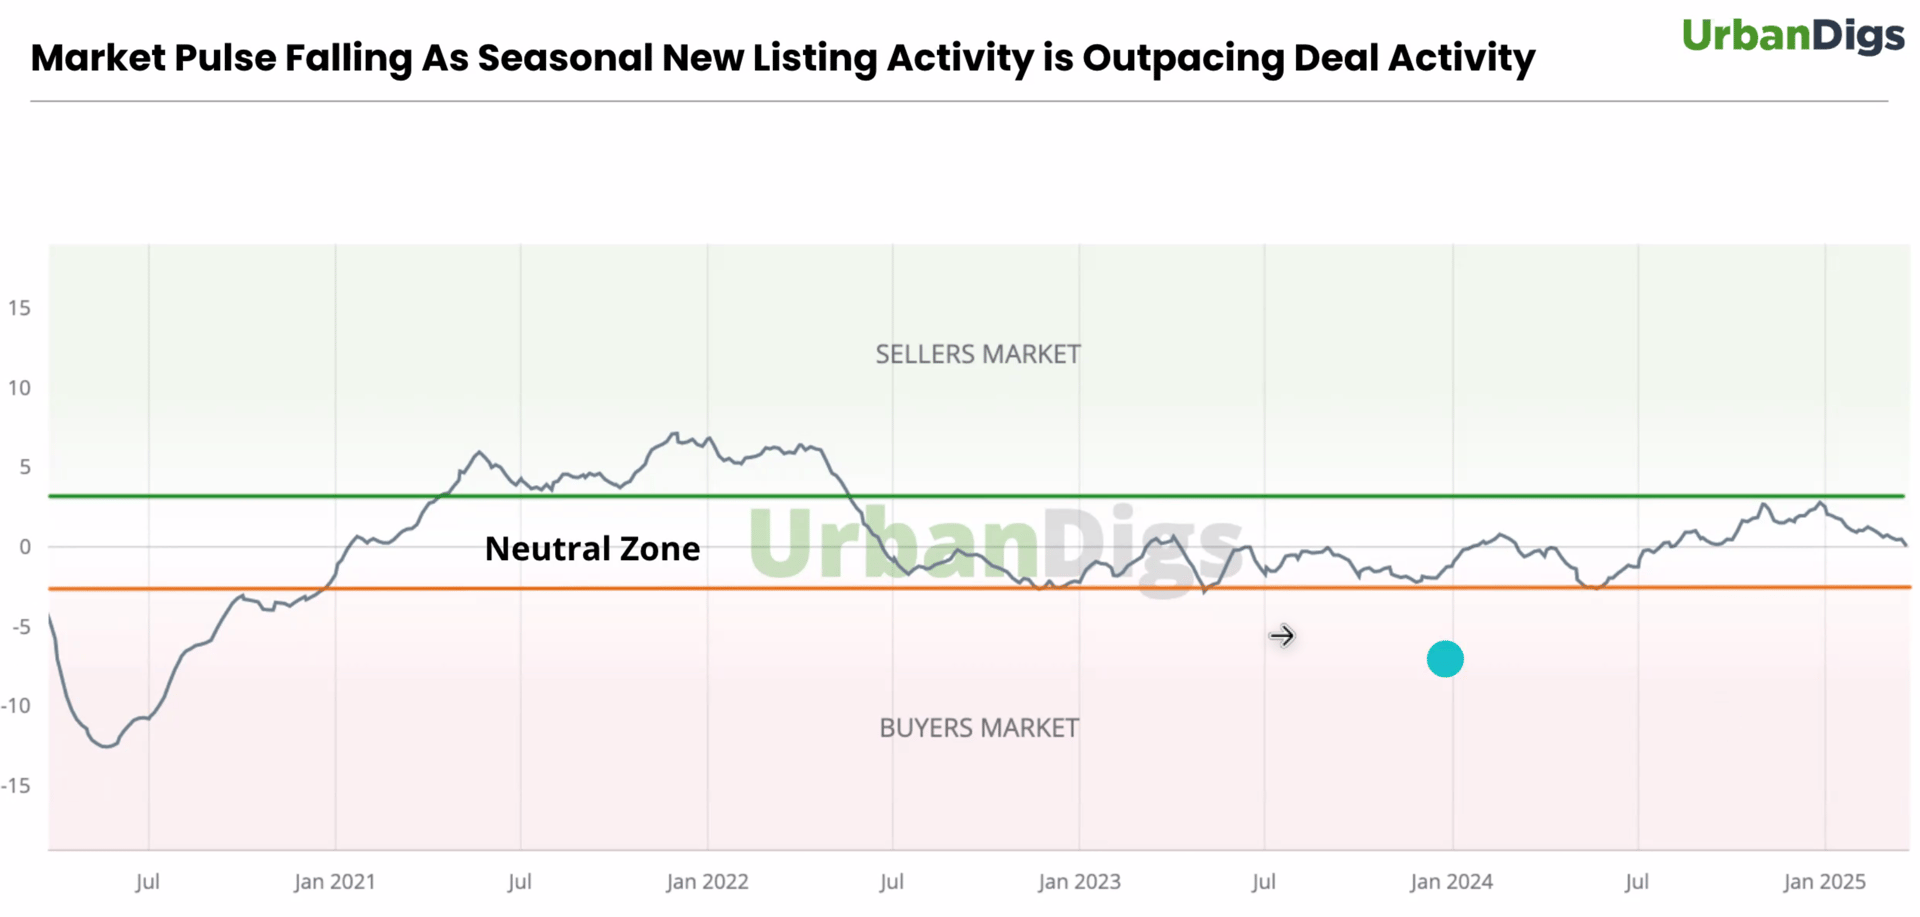
I am leaning on Urban Digs for this analysis, but once you take deal flow and new listings into consideration, it looks like this: There are more listings coming on the market than can be quickly absorbed. Therefore, there's more for buyers to choose from, and not enough buyers (yet) to keep up. This will keep prices steady as we get into the heart of the spring season. Urban Digs calls it the Market Pulse, which is exactly what we're looking for. Old sales prices, averages etc only get you so far. What you really want as a buyer or seller is to know whether your home will sell, or whether you'll be able to find something to buy that you like, at a price you can live with. The answer, growing more true every day is:
1) There will be a buyer for your home, assuming you're in "the zone" on price
2) There will be inventory as more sellers bring their properties to market
3) There will be modest price appreciation, but not a lot yet, though at the very high end it's an even more active market. Otherwise, you have a little time to get educated and confident. Nevertheless, be prepared!
I'll End with Two More Charts
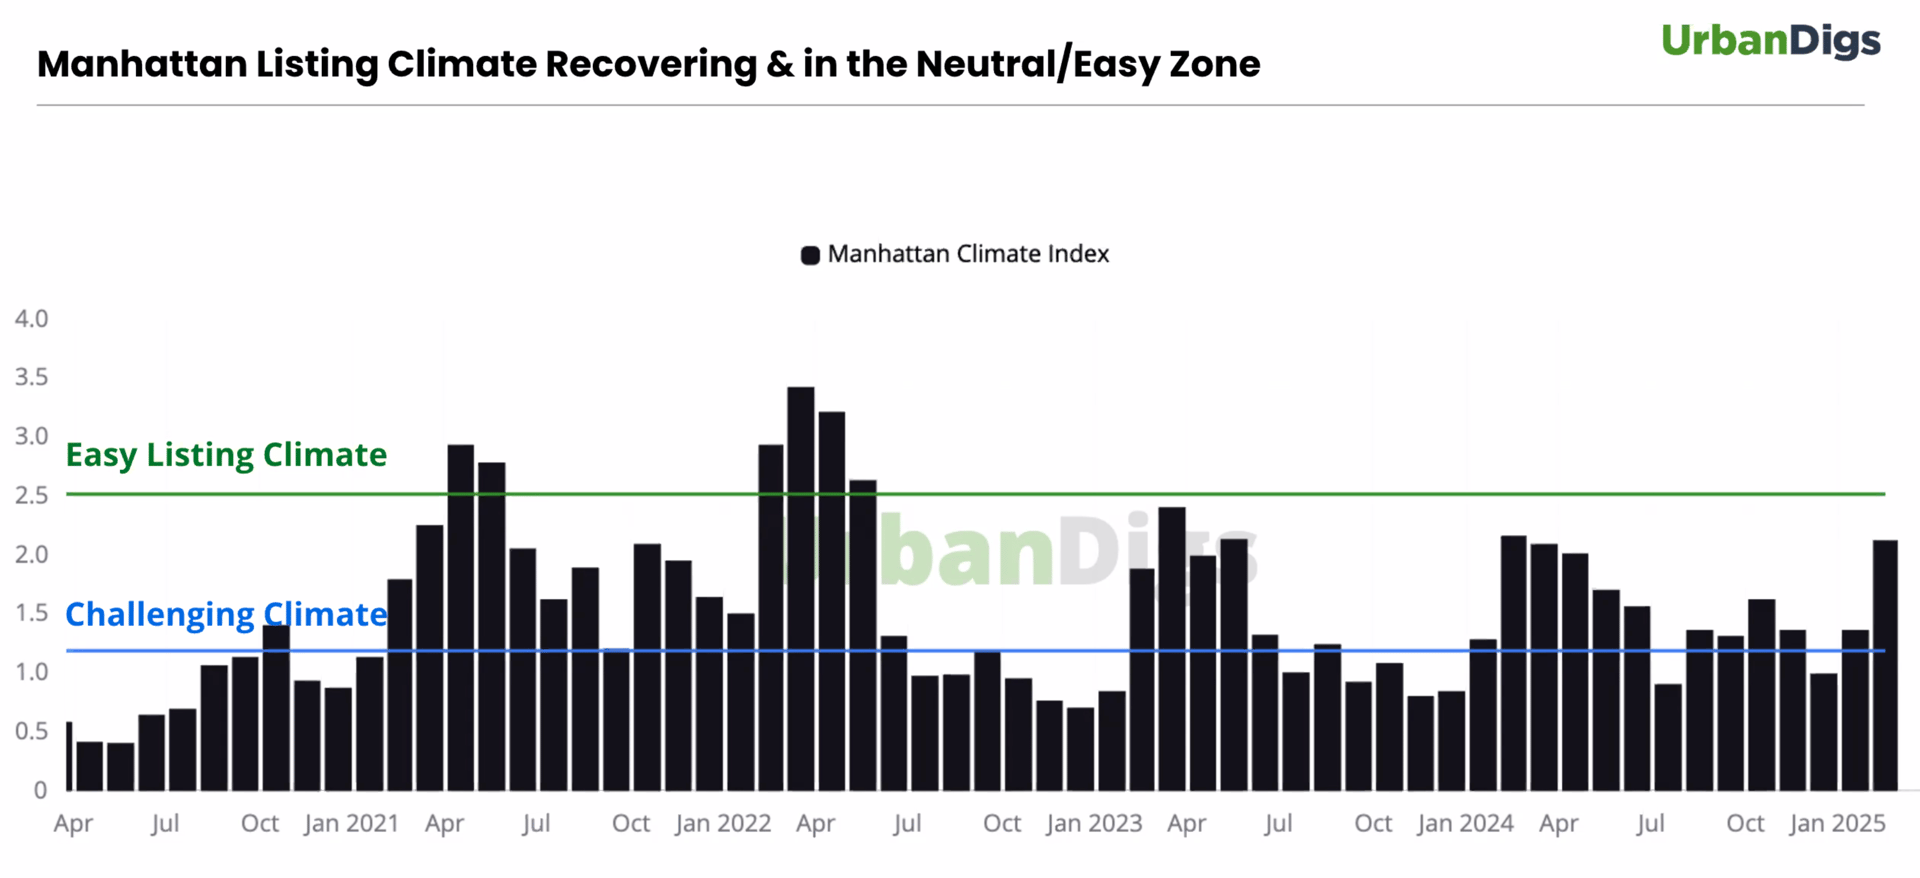
What I can pull from this chart is that buyers and sellers are aligning more often on price. Buyers are greeting the new listings with vigor. All but 2 months in the last year have been less challenging for sellers. Very encouraging!
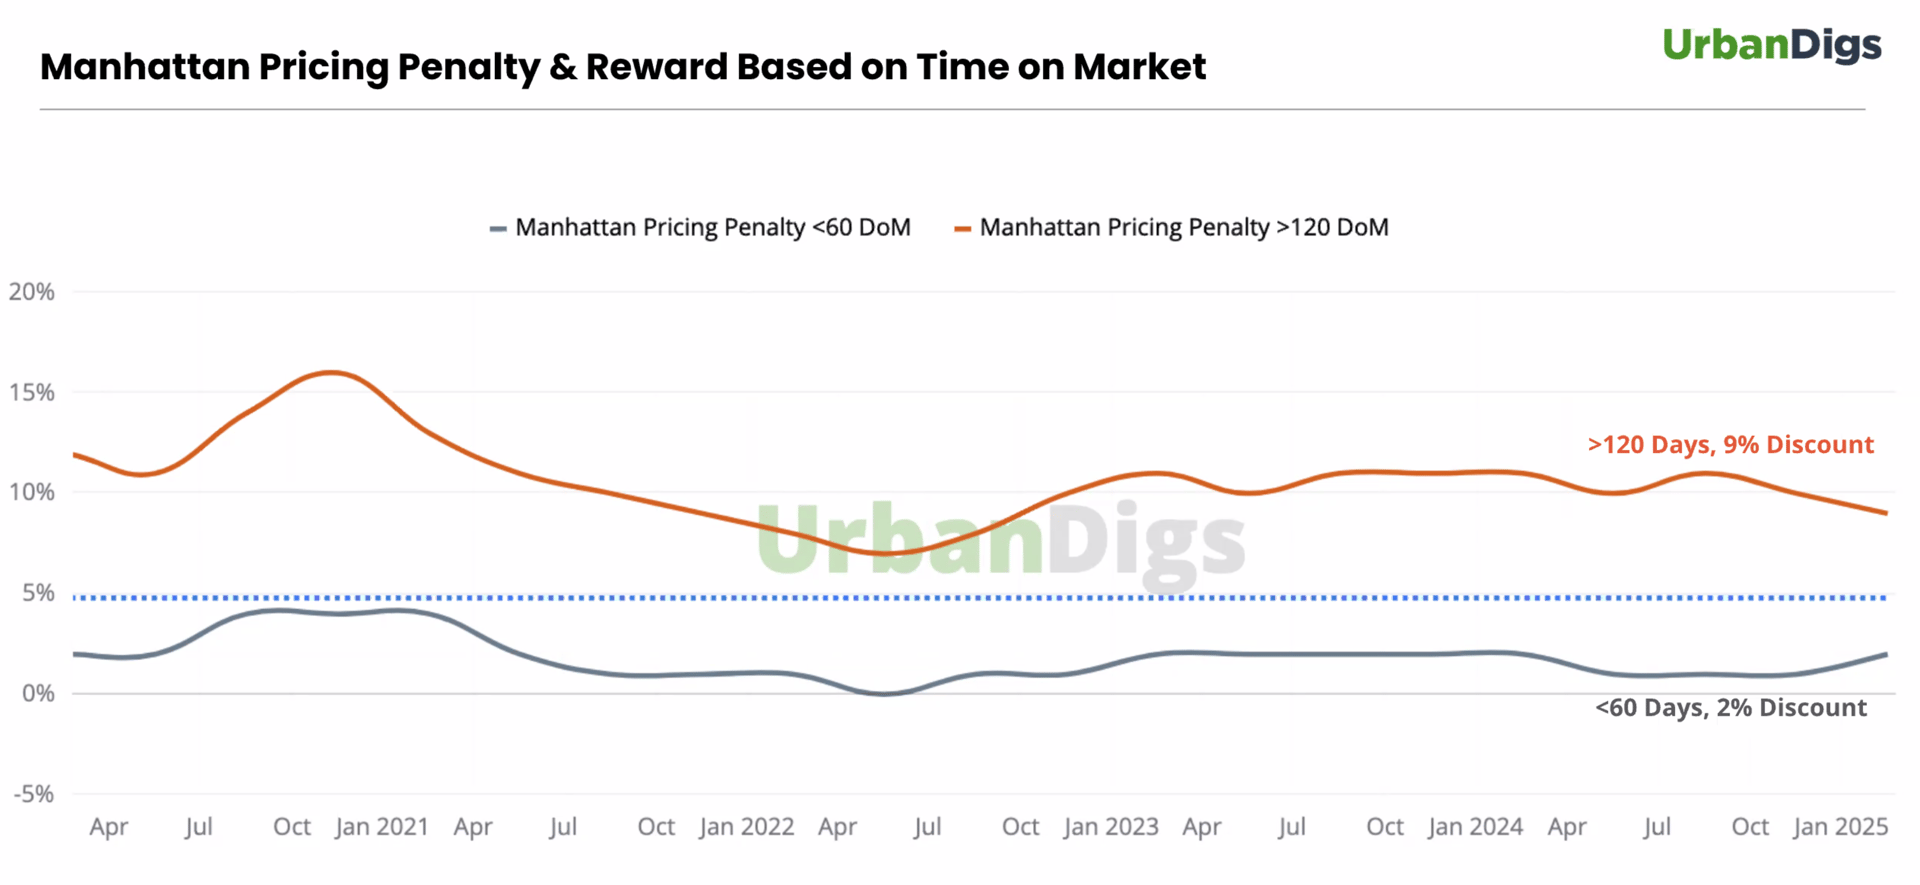
This is one more really important chart to consider. What it's showing is that if a property (grey line) goes into contract within 60 days, it's likely it was priced "correctly" and only had to offer a 2% discount. Whereas when you look at properties that took longer to sell, like 120 days (4 months), the average discount is currently 9% from the last asking price, BUT IS TRENDING DOWN. My takeaway is that buyers are more and more eager at all price points and apartment types- and if you're looking to buy, to expect less flexibility on pricing, whether you're paying all cash or whether the unit has been on the market for a while.
Again, the Takeaways
We're in that zone when buyers and sellers can both be happy. And that, my friends, is the sign of a healthy, or at least healthier, market. Have any questions about how to navigate these changes? Be in touch and our agents would be delighted to help you! - Scott & Magnetic